School has been out for a month. I have wanted to create an infographic as a snapshot of the library for 2016-17. After a week long vacation and taking some time off to read and read some more and visit with friends, I sat at the computer yesterday to make the infographic you will find at the end of this post. I used
Canva to create it. I only wanted a snapshot that touches a bit on what happened in the library this year because if I tried to cover everything, the reader would lose interest fast. If you want to know more about the PFTSTA Library then you would need to read posts from this blog or follow the library accounts on
Facebook, or
Instagram.
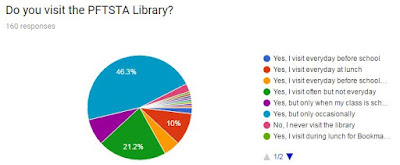
I took information from the report that I had to submit to the district on circulation and number of books. I looked at the stats for our databases and subscriptions and included those. At the end of the year, I sent out a form for students and teachers to give me some feedback about the library. It was mostly very positive. The quotes at the end of the infographic came from that Google Form that I sent out. I also got some nice stats on how the patrons read from the survey. Though those stats didn't fit into the infographic. I thought that I would share them here. I think that the graphics are self-explanatory.
 |
| Click the above image to enlarge it |
 |
| Click the above image to enlarge it |
 |
Click the above image to enlarge it
|
When I asked what books that students had read recently and loved, I got some interesting answers. Many of the students listed books that they were required to read for English class: The Lord of the Flies, The Round House, Fahrenheit 451, and The Wednesday Wars. There were the big name authors like Rick Riordan, James Patterson, and J. K. Rowling. There were also titles that were only mentioned by one student: Heartless by Marissa Meyer (a favorite of mine), Fuzzy Mud by Louis Sachar, The Storied Life of AJ Fikry by Gabrielle Zevin, and Aristotle and Dante Discover the Secrets of the Universe by Benjamin Saenz (another favorite of mine). Sci fi and fantasy have been the genres of choice at PFTSTA and continue to be popular among those taking the survey. Most responders still like to read print. When asked what they liked about the book selection at PFTSTA, they said overwhelmingly that the diverse and large collection is so vast that everyone can find something to read. In reality our collection is not that large with only 8000 volumes with just over half of those being fiction, but the library was created in 2006 to fit the needs and interests of the students. So what is on the shelves are books students want to read.
I did not question the students on the makerspace materials in the library. We do have many types of games, robots, and STEM materials with which the students can experiment. I did not mention much about it in the annual report, but we definitely have a busy makerspace. You can read about it and see a video here. |
State of the Library 2016-17 Infographic


Comments
Post a Comment